Because this site is not finished and neither is this research project, this page does not yet give access to a result of the NETCONF project.
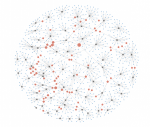
Instead, we offer you access to an interactive map created by Laurent Jégou as part of a collaborative work on the world geography of scientific production activities.
It presents the counts of publications broken down by urban agglomeration, according to their volume in 2010 and the evolution between 2000 and 2010.
The circles are positioned on the main locality of the agglomeration. Enjoy your visit!

Link to the interactive map